There are times when you enter the data wrongly and end up having the axis show up in a reversed manner. Then there are times when you realize it would be better to derive data if you flipped the axis altogether.
Recreating the same graph is a nightmare. Creating another table and reentering the values is not the ideal solution either. You’re looking for a better and more advanced solution that takes less time. Right?
Fortunately, you can change the axis in Excel. Moreover, you can also change values in one particular axis in case you want to exclude some cells.
Steps To Switch Axis in Excel
The right-click menu works just about fine for everything you want to do in a graph. All you need is a table that can create a chart with two headers that act as the X and Y axes. You then have to edit the data range and type one more time.
All this can be done through the right click. Here are some simple steps:
- Click on the chart that has the relevant values in the X and Y axis.
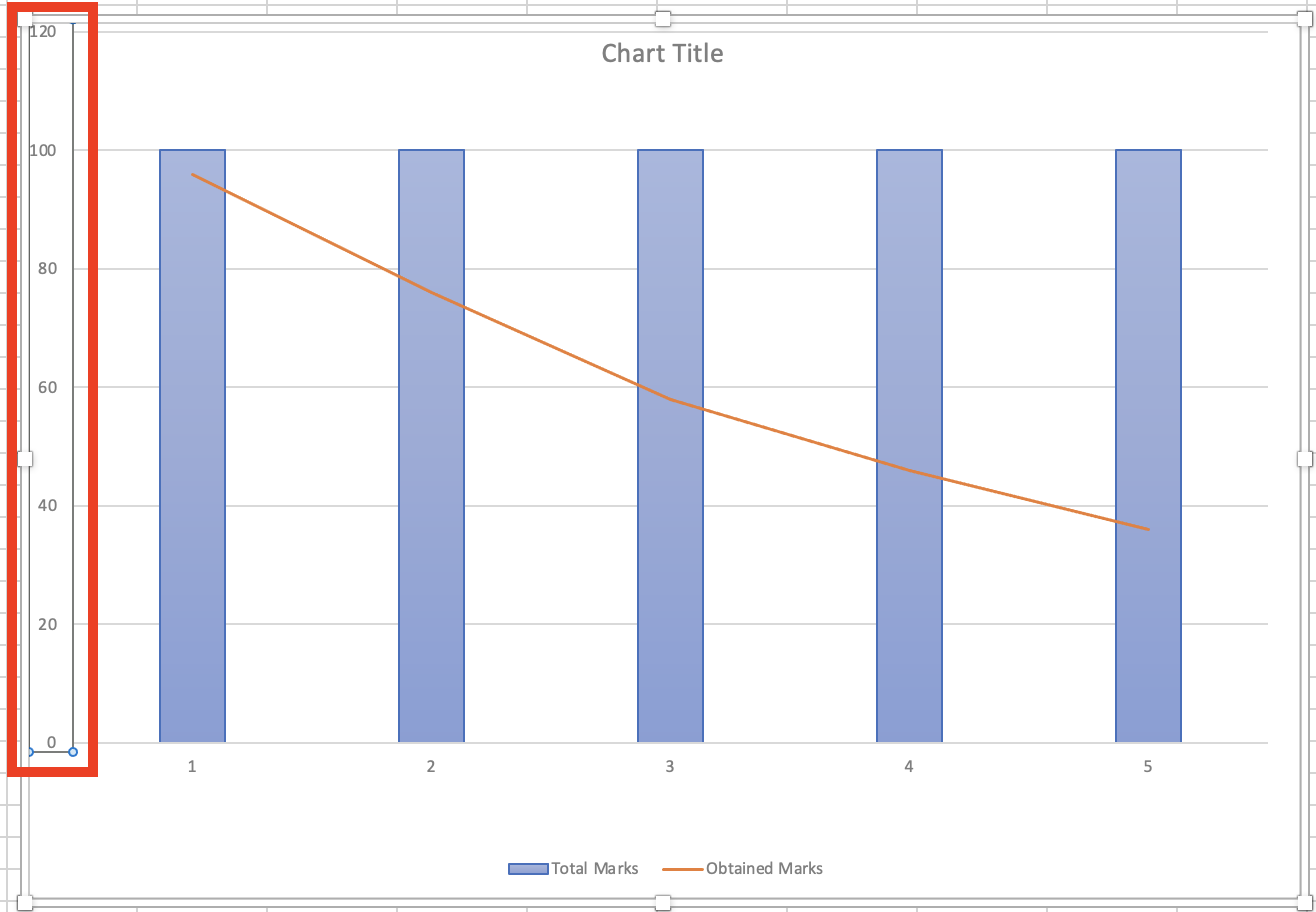
- Now select any one axis. Note that you will get the same options from the right click regardless of which axis you select.
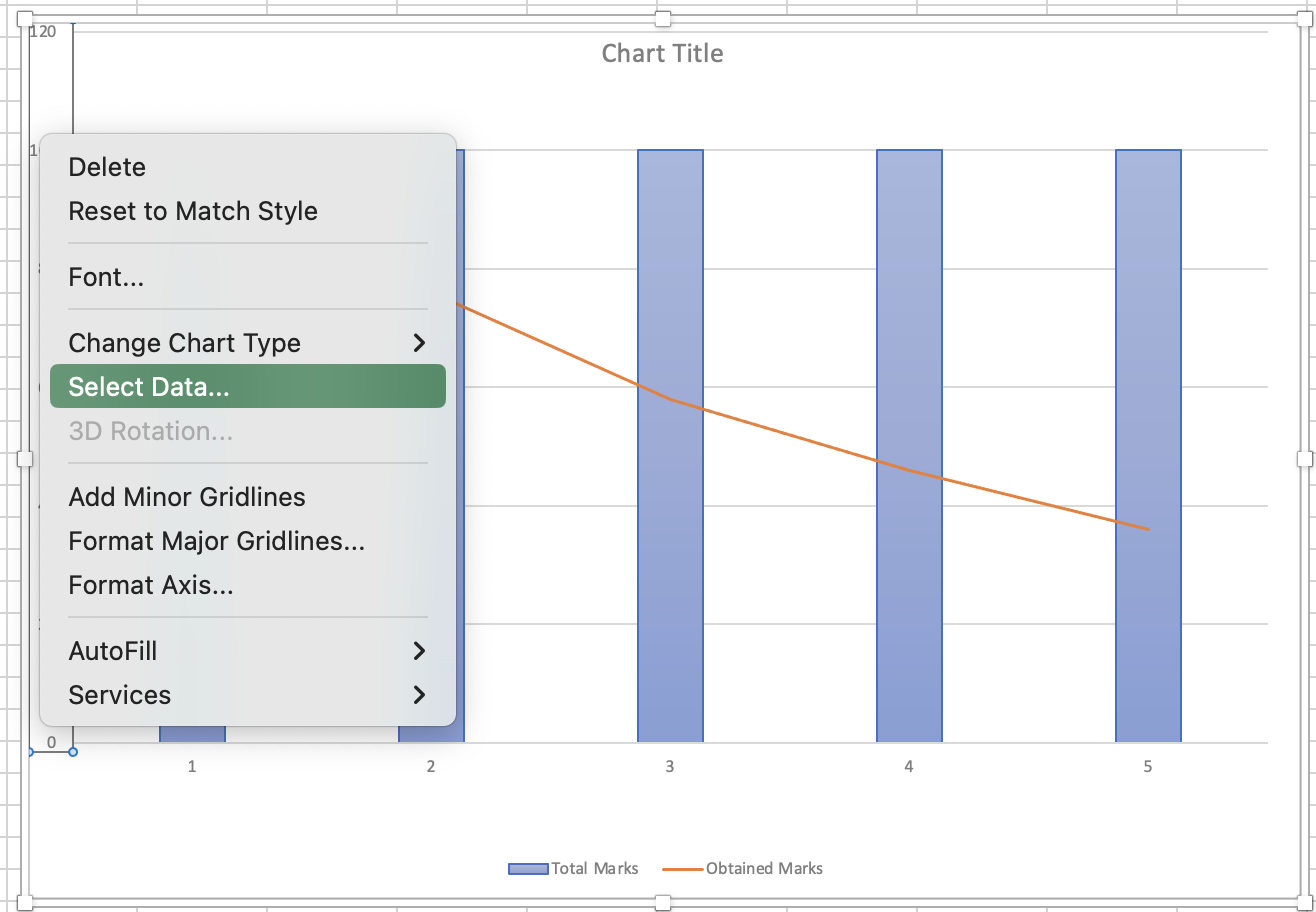
- Now right-click on the selection.
- Click on the “Select Data” option from the right-click menu.
- Locate the “Legend Entries (Series)” tab from the pop-up.
- You should see headings of both columns that represent both axes in an order where the first one represents the X-axis and the second one represents the Y-axis.
- Click on the first heading. Select “Edit”.
- Select all the data in the “Series name” field and remove it.
- Now click on the column in the table which you want to replace the axis with.
- Select all the data in the “Series values” field and remove it.
- Now select the cells in the table which you want to replace the axis with.
- Click on “OK”.
- Now click on the second heading in the list. Select “Edit”.
- Select all the data in the “Series name” field and remove it.
- Now click on the column in the table which you want to replace the axis with.
- Select all the data in the “Series values” field and remove it.
- Now select the cells in the table which you want to replace the axis with.
- Click on “OK”.
- Click on “OK” in the “Select data” pop-up.
That is it. You should now see both the axes reversed.
Steps To Change Values of One Axis in Excel
You can also change values of any one particular axis in a chart in Excel. Let us assume that you already have a table based on two columns and you have a separate column which you want to replace one of the axes with.
Now follow these steps to change values of any one axis in a chart in Excel.
- Click on the chart that has the relevant values in the X and Y axis.
- Now select the axis where you want to replace values.
- Now right click on the selection.
- Click on the “Select Data” option from the right click menu.
- Locate “Legend Entries (Series)” tab from the pop-up.
- You should see headings of both columns that represent both axes in an order where the first one represents X-axis and the second one represents Y-axis.
- Click on the heading (axis) you want to replace. Select “Edit”.
- Select all the data in the “Series name” field and remove it.
- Now Click on the column in the table which you want to replace the axis with.
- Select all the data in the “Series values” field and remove it.
- Now select the cells in the table which you want to replace the axis with.
- Click on “OK”.
You should not see the new values that you selected in the axis you selected.
Frequently Asked Questions
Right click on any axis and select “Format axis”. Now in the “Axis Options” tab from the pop-up, check the box that says “Values in reverse order”. This will reverse the order of the axis in Excel.
There is no in-built function to reverse the order of rows in Excel. But you can use combinations of formatting functions like INDEX and ROWS to swap values.
There is no keyboard shortcut to switch the X and Y axis in Excel but you can select the chart, go to the “Design” tab, and select “Switch Row/Column” which will switch the axes.
Yes, it is possible to move a row in Excel. There are multiple ways to do it. You may check out the linked article for the steps.
Wrap Up!
So there you go. The process to swap the values in both X and Y axis is quite cumbersome but you have to make sure you select the right data range to replace the values. Doing these steps in this method will also allow you to select any range to replace any one particular axis.


Leave a Reply