Interquartile Range of IQR, in mathematics terms, is defined as the difference between the third quartile (75th percentile) and first quartile (25th percentile), often abbreviated as Q3 and Q1, respectively.
In simple words, IQR is a measure that helps understand how spread out or varied the middle part (50%) of a set of data sets is.
If you’re using Excel 2007 or older, you’ll only find the QUARTILE function, but from the 2010 update, there’s a QUARTILE.INC and QUARTILE.EXC.
In this article, I’ll guide you through steps as to how you can use these functions along with some relevant information.
So, without further ado, let’s dig in!
Calculating Interquartile Range in Excel
There’s no direct method to find it, but there’s no rocket science involved. If you aren’t well-versed with formulas, the easiest way out is to find Q1 and Q3 values first and then use them to determine the IQR.
Note: QUARTILE.INC works similarly to the old QUARTILE function, where it uses the median to separate a dataset into two halves and includes the median to calculate Q1 & Q3, respectively.
On the other hand, the QUARTILE.EXC, after separating the dataset using the median, it is excluded when calculating Q1 and Q3.
Method 1: Using QUARTILE.INC Function
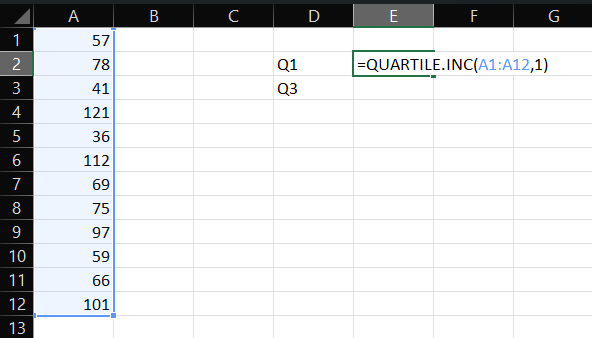
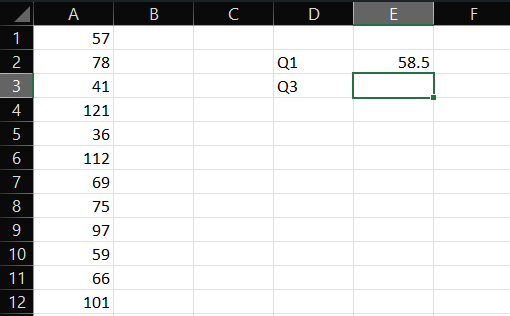
- Let’s start with calculating Q1. For that, click on an empty cell and type “=QUARTILE.INC(array,1)”. An array is the data of interest, so replace it with the data range by entering the cell number manually (for example, A1:A12) or simply select the top cell and drag down to cells containing the data. 1 in the formula is to return the answer to Q1 of the data.
- Then, Press Enter.
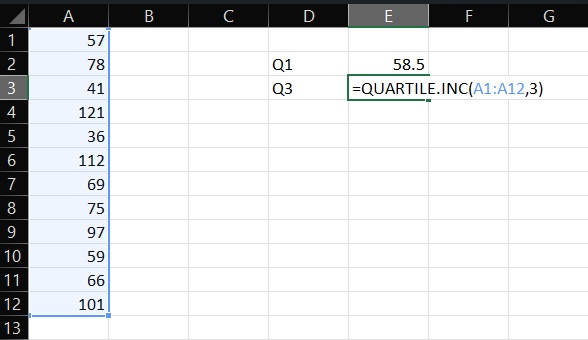
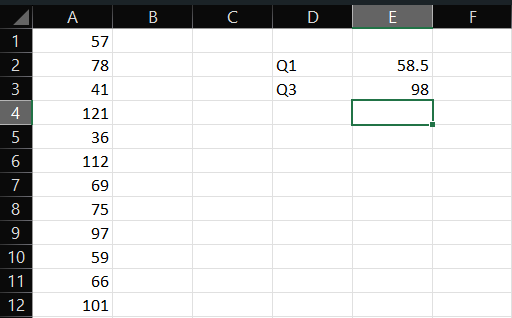
- Now, it’s time to calculate Q3. For that, again, find an empty cell, enter the formula “=QUARTILE.INC(array,3)”, and replace the “array” with the range of cells containing data of interest. Here’s an example:
- Then, press Enter.
- Now that you’ve done most of the work, i.e., calculated Q1 and Q3 values, it’s time to calculate the Interquartile range.
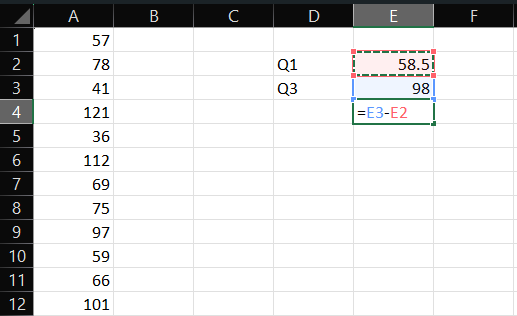
- For that, simply, subtract Q1 value away from the Q3 value. The formula should look like this: “E3-E2”, and then press Enter.
Method 2: Using QUARTILE.EXC Function
The method is exactly the same except for using the new function.
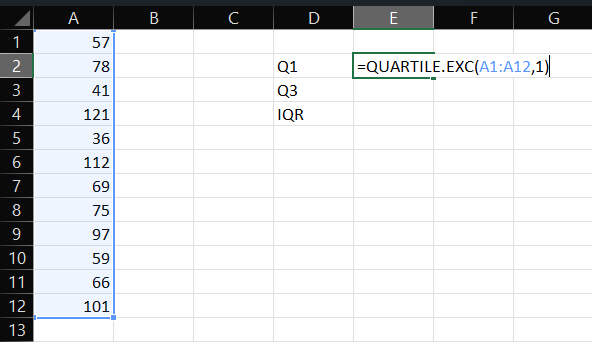
- Click on an empty cell, type the formula “=QUARTILE.EXC(array,1)”, and replace the “array” with cells containing data of interest. Here’s how it looks:
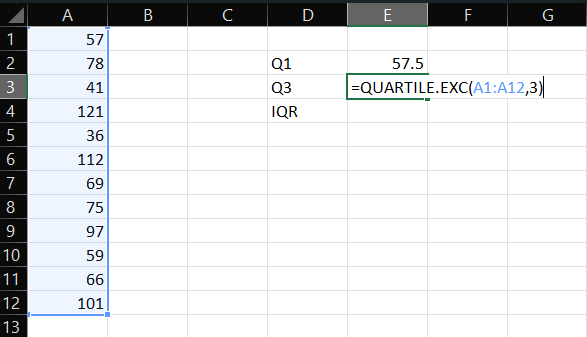
- Then, press Enter. Notice the change in value when the median value is not included in the calculation.
- Again click on an empty cell and type “=QUARTILE.EXC(array,3)”, and replace the “array” with data of interest.
- Then, press Enter.
- In the final step, subtract the Q1 and Q3 values using the formula “=E3-E2” and press Enter.
Did you know? Not just interquartile range, but you can also subtract two columns and square numbers in Excel.
Combining The Approach To Form a Single Equation
The approach mentioned above is rather long-winded and supposedly takes a bit more time. But if you’re confident in working with Excel and formulas, combining the steps into one is rather simple.
This should be the formula structure:
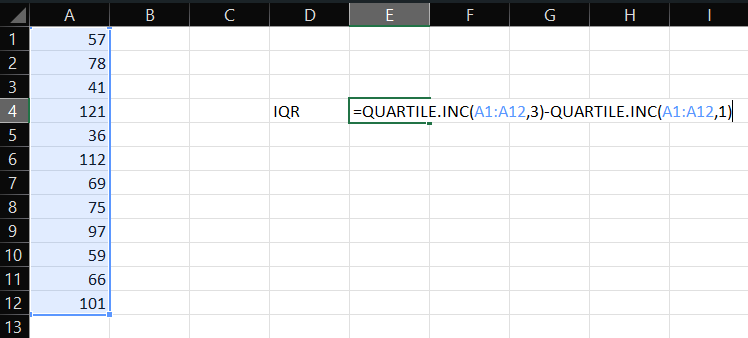
=QUARTILE.INC/QUARTILE.EXC (array, 3) – QUARTILE.INC/QUARTILE.EXC (array, 1)
- Just replace the array with the cells containing data. Here’s how the formula looks:
- Then, press Enter.
Frequently Asked Questions
There’s no correct way to calculate the quartiles of a dataset. Typically, different programming tools and languages use different tools to calculate quartiles. For example, Python programming language uses a formula that matches QUARTILE.INC, while TI-84 calculators use a formula that resembles the QUARTILE.EXC function.
Understanding the types of quartiles that exist is winning half the battle. As median is a robust measure, the differences between the two methods are very minimal and, in some cases, are exactly the same.
Interpreting an Interquartile Range Value involves understanding the spread or dispersion of a dataset, especially the middle 50%.
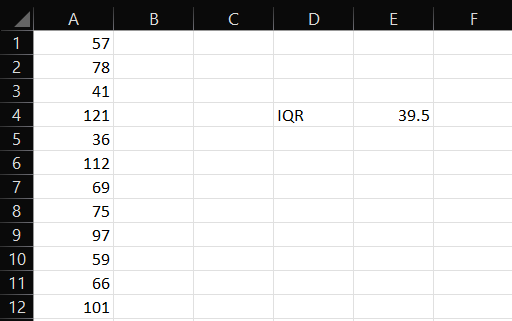
The large IQR value means greater dispersion or spread of the central portion of the dataset. The 39.5 value in my shared examples means the middle portion of datasets isn’t spread.
It means that 50% of the values are 39.5 points below and 39.5 points above the median.
Wrap Up!
With that comes an end to my guide. Aside from Excel, it’s possible to get the Interquartile value manually or using other programming languages and/or tools like TI-84 calculator or Python.
That said, I’ll see you in another such informational guide. Do write in the comments below if you’ve any queries or suggestions.
Leave a Reply